Search This Blog

Thursday, 3 June 2021

Installing Snyk Controller into a k3d kubernetes cluster to enable runtime container scanning with the Snyk Platform

Snyk integrates with Kubernetes, enabling you to import and test your running workloads and identify vulnerabilities in their associated images and configurations that might make those workloads less secure. Once imported, Snyk continues to monitor those workloads, identifying additional security issues as new images are deployed and the workload configuration changes

In the example below we show you how easy it is to integrate the Snyk Platform with any K8s distribution in this case k3d running on my laptop.

Steps 

1. Install k3d using the instructions from the link below.

https://k3d.io/

2. Create a cluster as shown below.

pasapicella@192-168-1-113:~/snyk/demos/kubernetes/k3d$ k3d cluster create snyk-k3d --servers 1 --agents 2
INFO[0000] Prep: Network
INFO[0003] Created network 'k3d-snyk-k3d'
INFO[0003] Created volume 'k3d-snyk-k3d-images'
INFO[0004] Creating node 'k3d-snyk-k3d-server-0'
INFO[0005] Creating node 'k3d-snyk-k3d-agent-0'
INFO[0005] Creating node 'k3d-snyk-k3d-agent-1'
INFO[0005] Creating LoadBalancer 'k3d-snyk-k3d-serverlb'
INFO[0005] Starting cluster 'snyk-k3d'
INFO[0005] Starting servers...
INFO[0005] Starting Node 'k3d-snyk-k3d-server-0'
INFO[0012] Starting agents...
INFO[0012] Starting Node 'k3d-snyk-k3d-agent-0'
INFO[0023] Starting Node 'k3d-snyk-k3d-agent-1'
INFO[0031] Starting helpers...
INFO[0031] Starting Node 'k3d-snyk-k3d-serverlb'
INFO[0033] (Optional) Trying to get IP of the docker host and inject it into the cluster as 'host.k3d.internal' for easy access
INFO[0036] Successfully added host record to /etc/hosts in 4/4 nodes and to the CoreDNS ConfigMap
INFO[0036] Cluster 'snyk-k3d' created successfully!
INFO[0036] --kubeconfig-update-default=false --> sets --kubeconfig-switch-context=false
INFO[0036] You can now use it like this:
kubectl config use-context k3d-snyk-k3d
kubectl cluster-info

3. View the Kubernetes nodes.

$ kubectl get nodes
NAME                    STATUS   ROLES                  AGE   VERSION
k3d-snyk-k3d-server-0   Ready    control-plane,master   21h   v1.20.5+k3s1
k3d-snyk-k3d-agent-0    Ready    <none>                 21h   v1.20.5+k3s1
k3d-snyk-k3d-agent-1    Ready    <none>                 21h   v1.20.5+k3s1

4.  Run the following command in order to add the Snyk Charts repository to Helm.

$ helm repo add snyk-charts https://snyk.github.io/kubernetes-monitor/
"snyk-charts" already exists with the same configuration, skipping

5. Once the repository is added, create a unique namespace for the Snyk controller:

$ kubectl create namespace snyk-monitor

6. Now, log in to your Snyk account and navigate to Integrations. Search for and click Kubernetes. Click Connect from the page that loads, copy the Integration ID. The Snyk Integration ID is a UUID, similar to this format: abcd1234-abcd-1234-abcd-1234abcd1234. Save it for use from your Kubernetes environment in the next step

Instructions link : https://support.snyk.io/hc/en-us/articles/360006368657-Viewing-your-Kubernetes-integration-settings

7. Snyk monitor runs by using your Snyk Integration ID, and using a dockercfg file. If you are not using any private registries which we are not in this demo, create a Kubernetes secret called snyk-monitor containing the Snyk Integration ID from the previous step and run the following command:

$ kubectl create secret generic snyk-monitor -n snyk-monitor \
         --from-literal=dockercfg.json={} \
         --from-literal=integrationId=INTEGRATION_TOKEN_FROM_STEP_6
secret/snyk-monitor created

8. Install the Snyk Helm chart as follows:

$ helm upgrade --install snyk-monitor snyk-charts/snyk-monitor \
                          --namespace snyk-monitor \
                          --set clusterName="k3d Dev cluster"
Release "snyk-monitor" does not exist. Installing it now.
NAME: snyk-monitor
LAST DEPLOYED: Wed Jun  2 17:47:13 2021
NAMESPACE: snyk-monitor
STATUS: deployed
REVISION: 1
TEST SUITE: None

9. Verify the Snyk Controller is running using either 

$ kubectl get pods -n snyk-monitor
NAME                           READY   STATUS    RESTARTS   AGE
snyk-monitor-64c94685b-fwpvx   1/1     Running   3          21h

10. At this point we can create some workloads as follows let's just add a single POD to the cluster for a basic Spring Boot application.

$ kubectl run springboot-app --image=pasapples/spring-boot-jib --port=8080
pod/springboot-app created

11. Head back to the Snyk Dashboard and click on your Kubernetes Integration Tile and you should see a list of applicable workloads to monitor in our case  we just have the single app called "springboot-app".


12. Add the selected workload and your done!!!


More Information


Install the Snyk controller with Helm

Thursday, 27 May 2021

Cloud Native Buildpacks meets Snyk Container

Cloud Native Buildpacks transform your application source code into images that can run on any cloud and avoid ever having a write Dockerfile again after all why would you even care about a Dockerfile?

So in today's post we are going to take a look at how Snyk App with Snyk Container can scan those Cloud Native Buildpack OCI images for you.  

Snyk Container equips developers to quickly fix container issues. Use the following to find out more about Snyk Container - https://snyk.io/product/container-vulnerability-management/

You may not always have access to the original source code that runs in your containers, but vulnerabilities in your code dependencies are still important. Snyk can detect and monitor open source dependencies for popular languages as part of the container scan which is important because Cloud Native Buildpacks are building container images from source code using popular programming languages.

Demo

1. First let's clone spring petclinic app and create our artifact for deployment.

$ git clone https://github.com/spring-projects/spring-petclinic
$ cd spring-petclinic
$ /mvnw package 

2. Install pack so we can build some OCI images directly into our registries from a simple CLI. Instructions as follows


3. Test kpack is installed by listing the suggested builders

$ pack --version
0.18.1+git-b5c1a96.build-2373

$ pack builder suggest
Suggested builders:
Google:                       gcr.io/buildpacks/builder:v1      
Heroku:                       heroku/buildpacks:18              
Heroku:                       heroku/buildpacks:20      
Paketo Buildpacks:     paketobuildpacks/builder:base    
Paketo Buildpacks:     paketobuildpacks/builder:full    
Paketo Buildpacks:     paketobuildpacks/builder:tiny

At this point we are ready to go so let's create 3 OCI images and push them to 3 separate regitries as follows

  • Dockerhub
  • Amazon Elastic Container Registry (ECR)
  • Google Cloud Registry (GCR)

Note: Your local docker desktop needs to be able to establish connections to the 3 registries above

4. Build an OCI image of petclinic to Dockerhub.

$ pack build pasapples/petclinic:latest --builder paketobuildpacks/builder:base --publish --path ./spring-petclinic/target/spring-petclinic-2.4.5.jar
base: Pulling from paketobuildpacks/builder
Digest: sha256:a6f81cb029d4d3272981c12dad7212a5063ec0076e2438b7b5bb702f2e1fd11a
Status: Image is up to date for paketobuildpacks/builder:base
===> DETECTING
5 of 18 buildpacks participating
paketo-buildpacks/ca-certificates   2.2.0
paketo-buildpacks/bellsoft-liberica 8.0.0

...

Adding label 'org.opencontainers.image.version'
Adding label 'org.springframework.boot.version'
Setting default process type 'web'
Saving pasapples/petclinic:latest...
*** Images (sha256:d730612833826cd9e39a7241c1fba411eacd9b5f771915b00af4b3b499838bd5):
      pasapples/petclinic:latest
Successfully built image pasapples/petclinic:latest


5. Build an OCI image of petclinic to ECR.

$ pack build 300326902600.dkr.ecr.us-east-1.amazonaws.com/petclinic:latest --builder paketobuildpacks/builder:base --publish --path ./spring-petclinic/target/spring-petclinic-2.4.5.jar
base: Pulling from paketobuildpacks/builder
Digest: sha256:a6f81cb029d4d3272981c12dad7212a5063ec0076e2438b7b5bb702f2e1fd11a
Status: Image is up to date for paketobuildpacks/builder:base
===> DETECTING
5 of 18 buildpacks participating
paketo-buildpacks/ca-certificates   2.2.0
paketo-buildpacks/bellsoft-liberica 8.0.0

...

Adding label 'org.opencontainers.image.version'
Adding label 'org.springframework.boot.version'
Setting default process type 'web'
Saving 300326902600.dkr.ecr.us-east-1.amazonaws.com/petclinic:latest...
*** Images (sha256:d730612833826cd9e39a7241c1fba411eacd9b5f771915b00af4b3b499838bd5):
      300326902600.dkr.ecr.us-east-1.amazonaws.com/petclinic:latest
Successfully built image 300326902600.dkr.ecr.us-east-1.amazonaws.com/petclinic:latest


6. Build an OCI image of petclinic to GCR.

$ pack build us.gcr.io/snyk-cx-se-demo/petclinic-google:latest --builder paketobuildpacks/builder:base --publish --path ./spring-petclinic/target/spring-petclinic-2.4.5.jar
base: Pulling from paketobuildpacks/builder
Digest: sha256:a6f81cb029d4d3272981c12dad7212a5063ec0076e2438b7b5bb702f2e1fd11a
Status: Image is up to date for paketobuildpacks/builder:base
===> DETECTING
5 of 18 buildpacks participating
paketo-buildpacks/ca-certificates   2.2.0
paketo-buildpacks/bellsoft-liberica 8.0.0

...

Adding label 'org.opencontainers.image.version'
Adding label 'org.springframework.boot.version'
Setting default process type 'web'
Saving us.gcr.io/snyk-cx-se-demo/petclinic-google:latest...
*** Images (sha256:d730612833826cd9e39a7241c1fba411eacd9b5f771915b00af4b3b499838bd5):
      us.gcr.io/snyk-cx-se-demo/petclinic-google:latest
Successfully built image us.gcr.io/snyk-cx-se-demo/petclinic-google:latest


Three OCI compliant images of petclinic in our 3 registries done!!!

So now it's over to Snyk.

7. Login Snyk App - https://app.snyk.io 

8. Lets do a scan from the CLI by first authenticating with Snyk App as follows which will direct you to a browser to authenticate once done return to the prompt.

$ snyk auth 

9. Now you can run a snyk container test to any of the 3 registries we used as follows.

$ snyk container test us.gcr.io/snyk-cx-se-demo/petclinic-google:latest

$ snyk container test 300326902600.dkr.ecr.us-east-1.amazonaws.com/petclinic:latest

$ snyk container test pasapples/petclinic:latest

Demo Output

Testing us.gcr.io/snyk-cx-se-demo/petclinic-google:latest...

✗ Low severity vulnerability found in shadow/passwd
  Description: Time-of-check Time-of-use (TOCTOU)
  Info: https://snyk.io/vuln/SNYK-UBUNTU1804-SHADOW-306209
  Introduced through: shadow/passwd@1:4.5-1ubuntu2, apt@1.6.13, shadow/login@1:4.5-1ubuntu2
  From: shadow/passwd@1:4.5-1ubuntu2
  From: apt@1.6.13 > adduser@3.116ubuntu1 > shadow/passwd@1:4.5-1ubuntu2
  From: shadow/login@1:4.5-1ubuntu2

...

✗ Medium severity vulnerability found in gcc-8/libstdc++6
  Description: Information Exposure
  Info: https://snyk.io/vuln/SNYK-UBUNTU1804-GCC8-572149
  Introduced through: gcc-8/libstdc++6@8.4.0-1ubuntu1~18.04, apt/libapt-pkg5.0@1.6.13, apt@1.6.13, meta-common-packages@meta
  From: gcc-8/libstdc++6@8.4.0-1ubuntu1~18.04
  From: apt/libapt-pkg5.0@1.6.13 > gcc-8/libstdc++6@8.4.0-1ubuntu1~18.04
  From: apt@1.6.13 > gcc-8/libstdc++6@8.4.0-1ubuntu1~18.04
  and 2 more...

Organization:      pas.apicella-41p
Package manager:   deb
Project name:      docker-image|us.gcr.io/snyk-cx-se-demo/petclinic-google
Docker image:      us.gcr.io/snyk-cx-se-demo/petclinic-google:latest
Platform:          linux/amd64
Licenses:          enabled

Tested 97 dependencies for known issues, found 25 issues.

10. Back to Snyk App we can import all 3 OCI images from all 3 registries once we configure each integration for the registries as shown below


11. And take a look at where the vulnerabilities exist within those open source dependencies used in our petclinic source code as well as base image layer vulnerabilities


Give Snyk App a go yourself and start scanning those OCI container images built using Cloud Native Buildpacks now!!!

More Information

Main Snyk Web Page

Snyk Container

Thursday, 25 February 2021

Elastic Cloud with Observability 7.11 Using Rancher k3d for K8s

Started working locally with rancher's k3d to spin up K8s clusters so I thought why not use Elastic Cloud with Elastic Observability to monitor this local K8s cluster and even run container workloads that use Elastic APM to monitor the application through tracing.

A successful Kubernetes monitoring solution has a few requirements:
  • Monitors all layers of your technology stack, including:
    • The host systems where Kubernetes is running.
    • Kubernetes core components, nodes, pods, and containers running within the cluster.
    • All of the applications and services running in Kubernetes containers.
  • Automatically detects and monitors services as they appear dynamically.
  • Provides a way to correlate related data so that you can group and explore related metrics, logs, and other observability data.

Some basic steps to get this running as per below. This was tested with Elastic Stack 7.11 using the Elastic Cloud Service

Pre Steps

1. I have my Elastic stack running using Elastic Cloud as per the screen shot below

2. I have k3d installed on my Mac as follows

$ k3d --version
k3d version v4.0.0
k3s version latest (default)

3. You will need the kubectl CLI as well

Steps

1. First let's start a K8s cluster as follows. I have created a 5 node K8s cluster with 1 master node but you can reduce the number of worker nodes if you don't have the memory to support this

$ k3d cluster create elastic-k3d --servers 1 --agents 5

2. Start your k3d cluster as follows if not already started

$ k3d cluster start elastic-k3d
INFO[0000] Starting cluster 'elastic-k3d'
INFO[0000] Starting Node 'k3d-elastic-k3d-agent-4'
INFO[0000] Starting Node 'k3d-elastic-k3d-agent-3'
INFO[0000] Starting Node 'k3d-elastic-k3d-agent-2'
INFO[0001] Starting Node 'k3d-elastic-k3d-agent-1'
INFO[0001] Starting Node 'k3d-elastic-k3d-agent-0'
INFO[0001] Starting Node 'k3d-elastic-k3d-server-0'
INFO[0002] Starting Node 'k3d-elastic-k3d-serverlb'

3. Let's list out our nodes just to verify what you created

$ k get nodes
NAME                       STATUS   ROLES                  AGE   VERSION
k3d-elastic-k3d-server-0   Ready    control-plane,master   34h   v1.20.2+k3s1
k3d-elastic-k3d-agent-4    Ready    <none>                 34h   v1.20.2+k3s1
k3d-elastic-k3d-agent-1    Ready    <none>                 34h   v1.20.2+k3s1
k3d-elastic-k3d-agent-3    Ready    <none>                 34h   v1.20.2+k3s1
k3d-elastic-k3d-agent-2    Ready    <none>                 34h   v1.20.2+k3s1
k3d-elastic-k3d-agent-0    Ready    <none>                 34h   v1.20.2+k3s1

Now it's time to "Monitor Kubernetes: Observe the health and performance of your Kubernetes deployments" To do that we could just follow this tutorial as shown below

https://www.elastic.co/guide/en/observability/7.11/monitor-kubernetes.html

This tutorial will walk you through how to do the following

Deploy filebeat into your k3d cluster
Deploy metricbeat into your k3d cluster
Deploy an application which is instrumented using the Elastic APM agent 

4. When installing filebeat and metricbeat make sure you add your Elastic Cloud credentials which can be obtained from the Elastic Cloud deployments page and would have also been provided as a XLS file to download once you create your deployment

filebeat-kubernetes.yaml

    processors:
      - add_cloud_metadata:
      - add_host_metadata:

    cloud.id: pas-K8s:{PASSWORD}
    cloud.auth: elastic:{PASSWORD}

metricbeat-kubernetes.yaml (Notice how I have added a kubernetes_metadata processor)

    processors:
      - add_host_metadata:
      - add_kubernetes_metadata:

    cloud.id: pas-K8s:{PASSWORD}
    cloud.auth: elastic:{PASSWORD}

5. Once installed filebeat and metricbeat PODS should be running as per the output below

Filebeat

$ kubectl get pods -n kube-system -l k8s-app=filebeat
NAME             READY   STATUS    RESTARTS   AGE
filebeat-m8s6s   1/1     Running   2          32h
filebeat-g86vf   1/1     Running   2          32h
filebeat-bj548   1/1     Running   2          32h
filebeat-5cpcn   1/1     Running   2          32h
filebeat-nwj2h   1/1     Running   2          32h
filebeat-4hs8j   1/1     Running   2          32h

Metricbeat

$ kubectl get pods -n kube-system -l k8s-app=metricbeat
NAME               READY   STATUS    RESTARTS   AGE
metricbeat-pbfvs   1/1     Running   2          32h
metricbeat-v5n8l   1/1     Running   2          32h
metricbeat-cdfz9   1/1     Running   2          32h
metricbeat-z85g8   1/1     Running   2          32h
metricbeat-4fxhh   1/1     Running   2          32h
metricbeat-g25lh   1/1     Running   2          32h

6. At this point it's worth heading to Kibana Obserability page and from there you will see we have logs and metrics from our local k3d K8s cluster as shown below


7. Now click on Metrics view and you can clearly see each of your k3d K8s nodes and by clicking on any node you get a very convenient view of metrics, process, metadata and more all from a single page. This was one of the new Elastic 7.11 features for Observability


8. Finally to deploy a application to this K8s cluster and have Elastic APM instrument it's activity you can either use the example in the tutorial link provided above OR just follow this very simple example to get this done

https://github.com/papicella/elastic-customer-api-rest


More Information

k3d Home Page
k3d 

Elastic Cloud Service
Elastic Cloud 

Wednesday, 3 February 2021

Elastic APM with Java Applications on Kubernetes

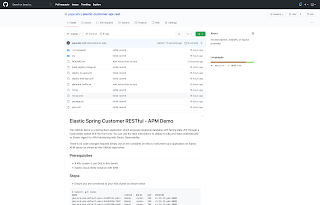
This GitHub demo is a Spring Boot application which accesses relational database with Spring Data JPA through a hypermedia-based RESTful front end. You can use the repo instructions to deploy to K8s and inject automatically an Elastic Agent for APM Monitoring with Elastic Observability.

There is no code changes required simply use an Init Container on K8s to instrument your application on Elastic APM server as shown by this GitHub repo below.

https://github.com/papicella/elastic-customer-api-rest


Try it out on your Kubernetes cluster using Elastic Cloud using our free 14 day trial


Tuesday, 29 December 2020

Loading Australian Football League (AFL) Data into the Elastic Stack with some cool visulaizations

I decided to load some AFL data into the Elastic Stack and do some basic visualisations. I loaded data for all home and away plus finals games since 2017 so four seasons in total. Follow below if you want to do the same. 

Steps

Note: We already have Elasticsearch cluster running for this demo

$ curl -u "elastic:welcome1" localhost:9200
{
  "name" : "node1",
  "cluster_name" : "apples-cluster",
  "cluster_uuid" : "hJrp2eJaRGCfBt7Zg_-EJQ",
  "version" : {
    "number" : "7.10.0",
    "build_flavor" : "default",
    "build_type" : "tar",
    "build_hash" : "51e9d6f22758d0374a0f3f5c6e8f3a7997850f96",
    "build_date" : "2020-11-09T21:30:33.964949Z",
    "build_snapshot" : false,
    "lucene_version" : "8.7.0",
    "minimum_wire_compatibility_version" : "6.8.0",
    "minimum_index_compatibility_version" : "6.0.0-beta1"
  },
  "tagline" : "You Know, for Search"
}  

First I need the data loaded into the Elastic Stack I did that using Squiggle API which you would do as follows

1. I use HTTPie rather then curl. 

http "https://api.squiggle.com.au/?q=games;complete=100" > games-2017-2020.json

2. Now this data itself needs to be altered slightly so I can BULK load it into Elasticsearch cluster and I do that as follows. I use JQ to do this.

$ cat games-2017-2020.json | jq -c '.games[] | {"index": {"_id": .id}}, .' > converted-games-2017-2020.json

Snippet I what the JSON file now looks like

{"index":{"_id":1}}

{"round":1,"hgoals":14,"roundname":"Round 1","hteamid":3,"hscore":89,"winner":"Richmond","ateam":"Richmond","hbehinds":5,"venue":"M.C.G.","year":2017,"complete":100,"id":1,"localtime":"2017-03-23 19:20:00","agoals":20,"date":"2017-03-23 19:20:00","hteam":"Carlton","updated":"2017-04-15 15:59:16","tz":"+11:00","ascore":132,"ateamid":14,"winnerteamid":14,"is_grand_final":0,"abehinds":12,"is_final":0}

{"index":{"_id":2}}

{"date":"2017-03-24 19:50:00","agoals":15,"ateamid":18,"winnerteamid":18,"hteam":"Collingwood","updated":"2017-04-15 15:59:16","tz":"+11:00","ascore":100,"is_grand_final":0,"abehinds":10,"is_final":0,"round":1,"hgoals":12,"hscore":86,"winner":"Western Bulldogs","ateam":"Western Bulldogs","roundname":"Round 1","hteamid":4,"hbehinds":14,"venue":"M.C.G.","year":2017,"complete":100,"id":2,"localtime":"2017-03-24 19:50:00"}

{"index":{"_id":3}}

{"hscore":82,"ateam":"Port Adelaide","winner":"Port Adelaide","roundname":"Round 1","hteamid":16,"round":1,"hgoals":12,"complete":100,"id":3,"localtime":"2017-03-25 16:35:00","venue":"S.C.G.","hbehinds":10,"year":2017,"ateamid":13,"winnerteamid":13,"updated":"2017-04-15 15:59:16","hteam":"Sydney","tz":"+11:00","ascore":110,"date":"2017-03-25 16:35:00","agoals":17,"is_final":0,"is_grand_final":0,"abehinds":8}

Load data into Elasticsearch cluster as follows

$ curl -u "elastic:welcome1" -H "Content-Type: application/json" -XPOST "localhost:9200/afl_games/_bulk?pretty&refresh"  --data-binary "@converted-games-2017-2020.json"

3. Using DevTools with Kibana we can run a query as follows

Question: Get each teams winning games for the season 2020 before finals - Final Ladder

Query:

GET afl_games/_search
{
  "size": 0, 
  "query": {
      "bool": {
        "must": [
          {
            "match": {
              "year": 2020
            }
          },
          {
            "match": {
              "is_final": 0
            }
          }
        ]
      }
    }, 
    "aggs": {
      "group_by_winner": {
        "terms": {
          "field": "winner.keyword",
          "size": 20
        }
      }
    }
} 

Results:

Results  
{
  "took" : 2,
  "timed_out" : false,
  "_shards" : {
    "total" : 1,
    "successful" : 1,
    "skipped" : 0,
    "failed" : 0
  },
  "hits" : {
    "total" : {
      "value" : 153,
      "relation" : "eq"
    },
    "max_score" : null,
    "hits" : [ ]
  },
  "aggregations" : {
    "group_by_winner" : {
      "doc_count_error_upper_bound" : 0,
      "sum_other_doc_count" : 0,
      "buckets" : [
        {
          "key" : "Brisbane Lions",
          "doc_count" : 14
        },
        {
          "key" : "Port Adelaide",
          "doc_count" : 14
        },
        {
          "key" : "Geelong",
          "doc_count" : 12
        },
        {
          "key" : "Richmond",
          "doc_count" : 12
        },
        {
          "key" : "West Coast",
          "doc_count" : 12
        },
        {
          "key" : "St Kilda",
          "doc_count" : 10
        },
        {
          "key" : "Western Bulldogs",
          "doc_count" : 10
        },
        {
          "key" : "Collingwood",
          "doc_count" : 9
        },
        {
          "key" : "Melbourne",
          "doc_count" : 9
        },
        {
          "key" : "Greater Western Sydney",
          "doc_count" : 8
        },
        {
          "key" : "Carlton",
          "doc_count" : 7
        },
        {
          "key" : "Fremantle",
          "doc_count" : 7
        },
        {
          "key" : "Essendon",
          "doc_count" : 6
        },
        {
          "key" : "Gold Coast",
          "doc_count" : 5
        },
        {
          "key" : "Hawthorn",
          "doc_count" : 5
        },
        {
          "key" : "Sydney",
          "doc_count" : 5
        },
        {
          "key" : "Adelaide",
          "doc_count" : 3
        },
        {
          "key" : "North Melbourne",
          "doc_count" : 3
        }
      ]
    }
  }
}

4. Finally using Kibana Lens to easily visualize this data using a Kibana Dasboard


Of course you could do much more plus load more data from Squiggle and with the power of Kibana feel free to create your own visualizations.

More Information

Squiggle API

https://api.squiggle.com.au/

Getting Started with the Elastic Stack

https://www.elastic.co/guide/en/elasticsearch/reference/current/getting-started.html

Tuesday, 22 December 2020

VMware Solutions Hub - Elastic Cloud on Kubernetes - the official Elasticsearch Operator from the creators

Proud to have worked on this with the VMware Tanzu team and Elastic team to add this to VMware Solution Hub page clearly highlighting what the Elastic Stack on Kubernetes really means.

Do you need to run your Elastic Stack on a certified Kubernetes distribution, bolstered by the global Kubernetes community allowing you to focus on delivering innovative applications powered by Elastic?

If so click below to get started:

https://tanzu.vmware.com/solutions-hub/data-management/elastic

More Information

https://tanzu.vmware.com/solutions-hub/data-management/elastic

Wednesday, 28 October 2020

How to Become a Kubernetes Admin from the Comfort of Your vSphere

 My Talk at VMworld 2020 with Olive power can be found here.

Talk Details

In this session, we will walk through the integration of VMware vSphere and Kubernetes, and how this union of technologies can fundamentally change how virtual infrastructure and operational engineers view the management of Kubernetes platforms. We will demonstrate the capability of vSphere to host Kubernetes clusters internally, allocate capacity to those clusters, and monitor them side by side with virtual machines (VMs). We will talk about how extended vSphere functionality eases the transition of enterprises to running yet another platform (Kubernetes) by treating all managed endpoints—be they VMs, Kubernetes clusters or pods—as one platform. We want to demonstrate that platforms for running modern applications can be facilitated through the intuitive interface of vSphere and its ecosystem of automation tooling

https://www.vmworld.com/en/video-library/search.html#text=%22KUB2038%22&year=2020

Thursday, 3 September 2020

java-cfenv : A library for accessing Cloud Foundry Services on the new Tanzu Application Service for Kubernetes

The Spring Cloud Connectors library has been with us since the launch event of Cloud Foundry itself back in 2011. This library would create the required Spring Beans from bound VCAP_SERVICE ENV variable from a pushed Cloud Foundry Application such as connecting to databases for example. The java buildpack then replaces these bean definitions you had in your application with those created by the connector library through a feature called ‘auto-reconfiguration’

Auto-reconfiguration is great for getting started. However, it is not so great when you want more control, for example changing the size of the connection pool associated with a DataSource.

With the up coming Tanzu Application Service for Kubernetes the original Cloud Foundry buildpacks are now replaced with the new Tanzu Buildpacks which are based on the Cloud Native Buildpacks CNCF Sandbox project. As a result of this auto-reconfiguration is no longer included in java cloud native buildpacks which means auto-configuration for the backing services is no longer available.

So is their another option for this? The answer is "Java CFEnv". This provide a simple API for retrieving credentials from the JSON strings contained inside the VCAP_SERVICES environment variable.

https://github.com/pivotal-cf/java-cfenv


So if you after exactly how it worked previously all you need to do is add this maven dependancy to your project as shown below.

  
        <dependency>
            <groupId>io.pivotal.cfenv</groupId>
            <artifactId>java-cfenv-boot</artifactId>
        </dependency>

Of course this new library is much more flexible then this and by using the class CfEnv as the entry point to the API for accessing Cloud Foundry environment variables your free to use the Spring Expression Language to invoke methods on the bean of type CfEnv to set properties for example plus more.

For more information read the full blog post as per below

https://spring.io/blog/2019/02/15/introducing-java-cfenv-a-new-library-for-accessing-cloud-foundry-services

Finally this Spring Boot application is an example of using this new library with an application deployed to the new Tanzu Application Service for Kubernetes.

https://github.com/papicella/spring-book-service


More Information

1. Introducing java-cfenv: A new library for accessing Cloud Foundry Services

https://spring.io/blog/2019/02/15/introducing-java-cfenv-a-new-library-for-accessing-cloud-foundry-services

2. Java CFEnv GitHub Repo

https://github.com/pivotal-cf/java-cfenv#pushing-your-application-to-cloud-foundry

Thursday, 6 August 2020

Configure a MySQL Marketplace service for the new Tanzu Application Service on Kubernetes using Container Services Manager for VMware Tanzu

The following post shows how to configure a MySQL service into the new Tanzu Application Service BETA version 0.3.0. For instructions on how to install the Container Services Manager for VMware Tanzu (KSM) see post below.

http://www.clue2solve.io/tanzu/2020/07/14/install-ksm-and-configure-the-cf-marketplace.html

Steps

It's assumed you have already installed KSM into your Kubernetes Cluster as shown below. If not please refer to the documentation to get this done first


$ kubectl get all -n ksm
NAME                                  READY   STATUS    RESTARTS   AGE
pod/ksm-chartmuseum-78d5d5bfb-2ggdg   1/1     Running   0          15d
pod/ksm-ksm-broker-6db696894c-blvpp   1/1     Running   0          15d
pod/ksm-ksm-broker-6db696894c-mnshg   1/1     Running   0          15d
pod/ksm-ksm-daemon-587b6fd549-cc7sv   1/1     Running   1          15d
pod/ksm-ksm-daemon-587b6fd549-fgqx5   1/1     Running   1          15d
pod/ksm-postgresql-0                  1/1     Running   0          15d

NAME                              TYPE           CLUSTER-IP       EXTERNAL-IP     PORT(S)        AGE
service/ksm-chartmuseum           ClusterIP      10.100.200.107   <none>          8080/TCP       15d
service/ksm-ksm-broker            LoadBalancer   10.100.200.229   10.195.93.188   80:30086/TCP   15d
service/ksm-ksm-daemon            LoadBalancer   10.100.200.222   10.195.93.179   80:31410/TCP   15d
service/ksm-postgresql            ClusterIP      10.100.200.213   <none>          5432/TCP       15d
service/ksm-postgresql-headless   ClusterIP      None             <none>          5432/TCP       15d

NAME                              READY   UP-TO-DATE   AVAILABLE   AGE
deployment.apps/ksm-chartmuseum   1/1     1            1           15d
deployment.apps/ksm-ksm-broker    2/2     2            2           15d
deployment.apps/ksm-ksm-daemon    2/2     2            2           15d

NAME                                        DESIRED   CURRENT   READY   AGE
replicaset.apps/ksm-chartmuseum-78d5d5bfb   1         1         1       15d
replicaset.apps/ksm-ksm-broker-6db696894c   2         2         2       15d
replicaset.apps/ksm-ksm-broker-8645dfcf98   0         0         0       15d
replicaset.apps/ksm-ksm-daemon-587b6fd549   2         2         2       15d

NAME                              READY   AGE
statefulset.apps/ksm-postgresql   1/1     15d

1. let's start by getting the Broker IP address which when installed using LoadBalancer type can be retrieved as shown below.

$ kubectl get service ksm-ksm-broker -n ksm -o=jsonpath='{@.status.loadBalancer.ingress[0].ip}'
10.195.93.188

2. Upgrade your Helm release by running the following using the IP address from above

$ export BROKER_IP=$(kubectl get service ksm-ksm-broker -n ksm -o=jsonpath='{@.status.loadBalancer.ingress[0].ip}')
$ helm upgrade ksm ./ksm -n ksm --reuse-values \
            --set cf.brokerUrl="http://$BROKER_IP" \
            --set cf.brokerName=KSM \
            --set cf.apiAddress="https://api.system.run.haas-210.pez.pivotal.io" \
            --set cf.username="admin" \
            --set cf.password="admin-password"

3. Next we configure the ksm CLI. You can download the CLI from here

configure-ksm-cli.sh

export KSM_IP=$(kubectl get service ksm-ksm-daemon -n ksm -o=jsonpath='{@.status.loadBalancer.ingress[0].ip}')
export KSM_TARGET=http://$KSM_IP:$(kubectl get svc ksm-ksm-daemon -n ksm -o=jsonpath='{@.spec.ports[0].port}')
export KSM_USER=admin
export KSM_PASSWORD=$(kubectl get secret -n ksm ksm-ksm-daemon -o=jsonpath='{@.data.SECURITY_USER_PASSWORD}' | base64 --decode)

4. Verify ksm CLI is configured correctly

$ ksm version
Client Version [0.10.80]
Server Version [0.10.80]

5. Create a YAML file for the KSM service account and ClusterRoleBinding using the following YAML:

ksm-sa.yml

---
apiVersion: v1
kind: ServiceAccount
metadata:
  name: ksm-admin
  namespace: kube-system
---
apiVersion: rbac.authorization.k8s.io/v1beta1
kind: ClusterRoleBinding
metadata:
  name: ksm-cluster-admin
roleRef:
  apiGroup: rbac.authorization.k8s.io
  kind: ClusterRole
  name: cluster-admin
subjects:
  - kind: ServiceAccount
    name: ksm-admin
    namespace: kube-system

Apply as follows

$ kubectl apply -f ksm-sa.yml

6. You need a cluster credential file to register and set default Kubernetes clusters that is done as follows

cluster-creds.sh

export kube_config="/Users/papicella/.kube/config"

cluster=`grep current $kube_config|sed "s/ //g"|cut -d ":" -f 2`

echo "Using cluster $cluster"

export server=`grep -B 2 "name: $cluster" $kube_config \
  |grep server|sed "s/ //g"|sed "s/^[^:]*://g"`

export certificate=`grep -B 2 "name: $cluster" $kube_config \
  |grep certificate|sed "s/ //g"|sed "s/.*://"`

export secret_name=$(kubectl get serviceaccount ksm-admin \
   --namespace=kube-system -o jsonpath='{.secrets[0].name}')

export secret_val=$(kubectl --namespace=kube-system get secret $secret_name \
   -o jsonpath='{.data.token}')

export secret_val=$(echo ${secret_val} | base64 --decode)

cat > cluster-creds.yaml << EOF
token: ${secret_val}
server: ${server}
caData: ${certificate}
EOF

echo ""
echo "ready to roll!!!!"
echo ""

Before running this script it's best to make sure you have targeted the correct K8s cluster you wish to. You can run a command as follows to verify that

$ kubectl config current-context
tas4k8s
 
7. Now we have a "cluster-creds.yaml" file we can go ahead and register the Kubernetes cluster with KSM as follows

$ ksm cluster register ksm-svcs ./cluster-creds.yaml
$ ksm cluster set-default ksm-svcs

Verify as follows:

$ ksm cluster list
CLUSTER NAME IP ADDRESS                                      DEFAULT
ksm-svcs    https://tas4k8s.run.haas-210.pez.pivotal.io:8443 true

8. Now we can go ahead and create a Marketplace offering for MySQL. To do that we will use the Bitnami MySQL chart as shown below

$ git clone https://github.com/bitnami/charts.git
$ cd ./charts/bitnami/mysql

** create bind.yaml as follows which is required so our service binding from Tanzu Application Service will inject the right JSON we are expecting or requiring at bind time **

$ cat bind.yaml
template: |
  local filterfunc(j) = std.length(std.findSubstr("mysql", j.name)) > 0;
  local s1 = std.filter(filterfunc, $.services);
  {
    hostname: s1[0].status.loadBalancer.ingress[0].ip,
    name: s1[0].name,
    jdbcUrl: "jdbc:mysql://" + self.hostname + "/my_db?user=" + self.username + "&password=" + self.password + "&useSSL=false",
    uri: "mysql://" + self.username + ":" + self.password + "@" + self.hostname + ":" + self.port + "/my_db?reconnect=true",
    password: $.secrets[0].data['mysql-root-password'],
    port: 3306,
    username: "root"
  }

$ helm package .
# cd ..
$ ksm offer save ./mysql ./mysql/mysql-6.14.7.tgz

Verify MySQL is now part of the offer list as follows
  
$ ksm offer list
MARKETPLACE NAME	INCLUDED CHARTS	VERSION	PLANS
rabbitmq        	rabbitmq       	6.18.1 	[persistent ephemeral]
mysql           	mysql          	6.14.7 	[default]

9. Now we need to login as an ADMIN user

Verify you are logged in as admin user using the CF CLI:

$ cf target
api endpoint:   https://api.system.run.haas-210.pez.pivotal.io
api version:    2.151.0
user:           admin
org:            system
space:          development

10. At this point you can see the KSM service broker registered with TAS4K8s as follows

$ cf service-brokers
Getting service brokers as admin...

name   url
KSM    http://10.195.93.188

11. Enable access to the MySQL service as follows

$ cf enable-service-access mysql

Verify it's enabled:

$ cf service-access
Getting service access as admin...
broker: KSM
   service    plan         access   orgs
   mysql      default      all
   rabbitmq   ephemeral    all
   rabbitmq   persistent   all

12. At this point it's best to log out of admin and log back in as a user that is not admin

$ cf target
api endpoint:   https://api.system.run.haas-210.pez.pivotal.io
api version:    2.151.0
user:           pas
org:            apples-org
space:          development

13. Create a MySQL service as follows. I passing in some JSON to indicate that my K8s cluster support's a LoadBalancer type so use that as part of the creation of the service.

$ cf create-service mysql default pas-mysql -c '{"service":{"type":"LoadBalancer"}}'

14. Check that the service has created correctly it will take a few minutes

$ cf services
Getting services in org apples-org / space development as pas...

name        service    plan        bound apps          last operation     broker   upgrade available
pas-mysql   mysql      default     my-springboot-app   create succeeded   KSM      no

15. Your service is created in it's own K8s namespace BUT that may not be the case at some point. 
$ kubectl get all -n ksm-2e526124-11a3-4d38-966c-b3ffd45471d7
NAME                            READY   STATUS    RESTARTS   AGE
pod/k-wqo5mubw-mysql-master-0   1/1     Running   0          15d
pod/k-wqo5mubw-mysql-slave-0    1/1     Running   0          15d

NAME                             TYPE           CLUSTER-IP       EXTERNAL-IP     PORT(S)          AGE
service/k-wqo5mubw-mysql         LoadBalancer   10.100.200.12    10.195.93.192   3306:30563/TCP   15d
service/k-wqo5mubw-mysql-slave   LoadBalancer   10.100.200.130   10.195.93.191   3306:31982/TCP   15d

NAME                                       READY   AGE
statefulset.apps/k-wqo5mubw-mysql-master   1/1     15d
statefulset.apps/k-wqo5mubw-mysql-slave    1/1     15d

16. At this point we can now test our new MySQL service we created and use a Spring Boot application to test this out with. 

The following GitHub repo can be used for that. Ignore the steps to create a service as you have already done that


Finally to define service plans see the link below

More Information

Container Services Manager(KSM)

Tanzu Application Service for Kubernetes

Monday, 3 August 2020

Using CNCF Sandbox Project Strimzi for Kafka Clusters on VMware Tanzu Kubernetes Grid Integrated Edition (TKGI)

Strimzi a CNCF sandbox project provides a way to run an Apache Kafka cluster on Kubernetes in various deployment configurations. In this post we will take a look at how to get this running on VMware Tanzu Kubernetes Grid Integrated Edition (TKGI) and consume the Kafka cluster from a Springboot application.

If you have a K8s cluster that's all you need to follow along in this exampleI am using VMware Tanzu Kubernetes Grid Integrated Edition (TKGI) but you can use any K8s cluster you have such as GKE, AKS, EKS etc.

Steps

1. Installing Strimzi is pretty straight forward so we can do that as follows. I am using the namespace "kafka" which needs to be created prior to running this command.

kubectl apply -f 'https://strimzi.io/install/latest?namespace=kafka' -n kafka

2. Verify that the operator was installed correctly and we have a running POD as shown below
  
$ kubectl get pods -n kafka
NAME                                                    READY   STATUS    RESTARTS   AGE
strimzi-cluster-operator-6c9d899778-4mdtg               1/1     Running   0          6d22h

3. Next let's ensure we have a default storage class for the cluster as shown below.

$ kubectl get storageclass
NAME             PROVISIONER                    AGE
fast (default)   kubernetes.io/vsphere-volume   47d

4. Now at this point we are ready to create a Kafka cluster. For this example we will create a 3 node cluster defined in YML as follows.

kafka-persistent-MULTI_NODE.yaml

apiVersion: kafka.strimzi.io/v1beta1
kind: Kafka
metadata:
  name: apples-kafka-cluster
spec:
  kafka:
    version: 2.5.0
    replicas: 3
    listeners:
      external:
        type: loadbalancer
        tls: false
      plain: {}
      tls: {}
    config:
      offsets.topic.replication.factor: 3
      transaction.state.log.replication.factor: 3
      transaction.state.log.min.isr: 2
      log.message.format.version: "2.5"
    storage:
      type: jbod
      volumes:
      - id: 0
        type: persistent-claim
        size: 100Gi
        deleteClaim: false
  zookeeper:
    replicas: 3
    storage:
      type: persistent-claim
      size: 100Gi
      deleteClaim: false
  entityOperator:
    topicOperator: {}
    userOperator: {}

Few things to note:
  • We have enable access to the cluster using the type LoadBalancer which means your K8s cluster needs to support such a Type
  • We need to create dynamic Persistence claim's in the cluster so ensure #3 above is in place
  • We have disabled TLS given this is a demo 
5. Create the Kafka cluster as shown below ensuring we target the namespace "kafka"

$ kubectl apply -f kafka-persistent-MULTI_NODE.yaml -n kafka

6. Now we can view the status/creation of our cluster one of two ways as shown below. You will need to wait a few minutes for everything to start up.

Option 1:
  
$ kubectl get Kafka -n kafka
NAME                   DESIRED KAFKA REPLICAS   DESIRED ZK REPLICAS
apples-kafka-cluster   3                        3             1/1     Running   0          6d22h

Option 2:
  
$ kubectl get all -n kafka
NAME                                                        READY   STATUS    RESTARTS   AGE
pod/apples-kafka-cluster-entity-operator-58685b8fbd-r4wxc   3/3     Running   0          6d21h
pod/apples-kafka-cluster-kafka-0                            2/2     Running   0          6d21h
pod/apples-kafka-cluster-kafka-1                            2/2     Running   0          6d21h
pod/apples-kafka-cluster-kafka-2                            2/2     Running   0          6d21h
pod/apples-kafka-cluster-zookeeper-0                        1/1     Running   0          6d21h
pod/apples-kafka-cluster-zookeeper-1                        1/1     Running   0          6d21h
pod/apples-kafka-cluster-zookeeper-2                        1/1     Running   0          6d21h
pod/strimzi-cluster-operator-6c9d899778-4mdtg               1/1     Running   0          6d23h

NAME                                                    TYPE           CLUSTER-IP       EXTERNAL-IP     PORT(S)                      AGE
service/apples-kafka-cluster-kafka-0                    LoadBalancer   10.100.200.90    10.195.93.200   9094:30362/TCP               6d21h
service/apples-kafka-cluster-kafka-1                    LoadBalancer   10.100.200.179   10.195.93.197   9094:32022/TCP               6d21h
service/apples-kafka-cluster-kafka-2                    LoadBalancer   10.100.200.155   10.195.93.201   9094:32277/TCP               6d21h
service/apples-kafka-cluster-kafka-bootstrap            ClusterIP      10.100.200.77    <none>          9091/TCP,9092/TCP,9093/TCP   6d21h
service/apples-kafka-cluster-kafka-brokers              ClusterIP      None             <none>          9091/TCP,9092/TCP,9093/TCP   6d21h
service/apples-kafka-cluster-kafka-external-bootstrap   LoadBalancer   10.100.200.58    10.195.93.196   9094:30735/TCP               6d21h
service/apples-kafka-cluster-zookeeper-client           ClusterIP      10.100.200.22    <none>          2181/TCP                     6d21h
service/apples-kafka-cluster-zookeeper-nodes            ClusterIP      None             <none>          2181/TCP,2888/TCP,3888/TCP   6d21h

NAME                                                   READY   UP-TO-DATE   AVAILABLE   AGE
deployment.apps/apples-kafka-cluster-entity-operator   1/1     1            1           6d21h
deployment.apps/strimzi-cluster-operator               1/1     1            1           6d23h

NAME                                                              DESIRED   CURRENT   READY   AGE
replicaset.apps/apples-kafka-cluster-entity-operator-58685b8fbd   1         1         1       6d21h
replicaset.apps/strimzi-cluster-operator-6c9d899778               1         1         1       6d23h

NAME                                              READY   AGE
statefulset.apps/apples-kafka-cluster-kafka       3/3     6d21h
statefulset.apps/apples-kafka-cluster-zookeeper   3/3     6d21h                     3             1/1     Running   0          6d22h

7. Our entry point into the cluster is a service of type LoadBalancer which we asked for as per our Kafka cluster YML config. To find the IP address we can run a command as follow using the cluster name from above.

$ kubectl get service -n kafka apples-kafka-cluster-kafka-external-bootstrap -o=jsonpath='{.status.loadBalancer.ingress[0].ip}{"\n"}'
10.195.93.196

Note: Make a not of this IP address as we will need it shortly

8. Let's create a Kafka Topic using YML as follows. In this YML we actually ensure we are using the namespace "kafka".  

create-kafka-topic.yaml

apiVersion: kafka.strimzi.io/v1beta1
kind: KafkaTopic
metadata:
  name: apples-topic
  namespace: kafka
  labels:
    strimzi.io/cluster: apples-kafka-cluster
spec:
  partitions: 1
  replicas: 1
  config:
    retention.ms: 7200000
    segment.bytes: 1073741824


9. Create a Kafka topic as shown below.

$ kubectl apply -f create-kafka-topic.yaml

10. We can view the Kafka topics as shown below.
  
$ kubectl get KafkaTopic -n kafka
NAME                                                          PARTITIONS   REPLICATION FACTOR
apples-topic                                                  1            1

11. Now at this point we ready to send some messages to our topic "apples-topic" as well as consume messages so to do that we are going to use a Springboot Application in fact two of them which exist on GitHub.


Download or clone those onto your file system. 

12.With both downloaded you will need to set the spring.kafka.bootstrap-servers with the IP address we retrieved from #7 above. That needs to be done in both GitHub downloaded/cloned repo's above. The file we need to edit for both repo's is as follows. 

File: src/main/resources/application.yml 

Example:

spring:
  kafka:
    bootstrap-servers: IP-ADDRESS:9094

Note: Make sure you do this for both downloaded repo application.yml files

13. Now let's run the producer and consumer Springboot application using a command as follows in seperate terminal windows. One will use PORT 8080 while the other uses port 8081.

$ ./mvnw spring-boot:run

Consumer:

papicella@papicella:~/pivotal/DemoProjects/spring-starter/pivotal/KAFKA/demo-kafka-producer$ ./mvnw spring-boot:run

...
2020-08-03 11:41:46.742  INFO 34025 --- [           main] o.s.b.w.embedded.tomcat.TomcatWebServer  : Tomcat started on port(s): 8080 (http) with context path ''
2020-08-03 11:41:46.754  INFO 34025 --- [           main] a.a.t.k.DemoKafkaProducerApplication     : Started DemoKafkaProducerApplication in 1.775 seconds (JVM running for 2.102)

Producer:

papicella@papicella:~/pivotal/DemoProjects/spring-starter/pivotal/KAFKA/demo-kafka-consumer$ ./mvnw spring-boot:run

...
2020-08-03 11:43:53.423  INFO 34056 --- [           main] o.s.b.w.embedded.tomcat.TomcatWebServer  : Tomcat started on port(s): 8081 (http) with context path ''
2020-08-03 11:43:53.440  INFO 34056 --- [           main] a.a.t.k.DemoKafkaConsumerApplication     : Started DemoKafkaConsumerApplication in 1.666 seconds (JVM running for 1.936)

14. Start by opening up the the Producer UI by navigating to http://localhost:8080/


15. Now let's not add any messages yet and also open up the Consumer UI by navigating to http://localhost:8081/


Note: This application will automatically refresh the page every 2 seconds to show which messages have been sent to the Kafka Topic

16. Return to the Producer UI http://localhost:8080/ and add two messages using whatever text you like as shown below.


17. Return to the Consumer UI http://localhost:8081/ to verify the two messages sent to the Kafka topic has been consumed


18. Both these Springboot applications are using "Spring for Apache Kafka


Both Springboot application use a application.yml to bootstrap access to the Kafka cluster

The Producer Springboot application is using a KafkaTemplate to send messages to our Kafka Topic as shown below.
  
@Controller
@Slf4j
public class TopicMessageController {

    private KafkaTemplate<String, String> kafkaTemplate;

    @Autowired
    public TopicMessageController(KafkaTemplate<String, String> kafkaTemplate) {
        this.kafkaTemplate = kafkaTemplate;
    }

    final private String topicName = "apples-topic";

    @GetMapping("/")
    public String indexPage (Model model){
        model.addAttribute("topicMessageAddSuccess", "N");
        return "home";
    }

    @PostMapping("/addentry")
    public String addNewTopicMessage (@RequestParam(value="message") String message, Model model){

        kafkaTemplate.send(topicName, message);

        log.info("Sent single message: " + message);
        model.addAttribute("message", message);
        model.addAttribute("topicMessageAddSuccess", "Y");

        return "home";
    }
}                                                

The Consumer Springboot application is configured with a KafkaListener as shown below
  
@Controller
@Slf4j
public class TopicConsumerController {

    private static ArrayList<String> topicMessages = new ArrayList<String>();

    @GetMapping("/")
    public String indexPage (Model model){
        model.addAttribute("topicMessages", topicMessages);
        model.addAttribute("topicMessagesCount", topicMessages.size());

        return "home";
    }

    @KafkaListener(topics = "apples-topic")
    public void listen(String message) {
        log.info("Received Message: " + message);
        topicMessages.add(message);
    }
}                                              

In this post we did not setup any client authentication against the cluster for the producer or consumer given this was just a demo.


More Information

Spring for Apache Kafka

CNCF Sanbox projects

Strimzi