https://blogs.vmware.com/cloudnative/2019/08/26/vmware-tanzu-mission-control/
In this blog I show you how easily you can use TMC to monitor your existing k8s clusters. Keep in mind TMC can also create k8s clusters for you but here we will use the "Attach Cluster" part of TMC. Demo as follows
1. Of course you will need access account on TMC which for this demo I already have. Once logged in you will see a home screen as follows
2. In the right hand corner there is a "Attach Cluster" button click this to attach an existing cluster to TMC. Enter some cluster details , in this case I am attaching to a k8s cluster on GKE and giving it a name "pas-gke-cluster".
3. Click the "Register" button which takes you to a screen which allows you to install the VMware Tanzu Mission Control agent. This is simply done by using "kubectl apply ..." on your k8s cluster which allows an agent to communicate back to TMC itself. Everything is created in a namespace called "vmware-system-tmc"
4. Once you have run the "kubectl apply .." on your cluster you can verify the status of the pods and other components installed as follows
$ kubectl get all --namespace=vmware-system-tmc
Or you could just check the status of the various pods as shown below and assume everything else was created ok
$ kubectl get pods --namespace=vmware-system-tmc
NAME                                     READY   STATUS      RESTARTS   AGE
agent-updater-67bb5bb9c6-khfwh           1/1     Running     0          74m
agentupdater-workload-1581383460-5dsx9   0/1     Completed   0          59s
data-protection-657d8bf96c-v627g         1/1     Running     0          73m
extension-manager-857d46c6c-zfzbj        1/1     Running     0          74m
extension-updater-6ddd9858cf-lr88r       1/1     Running     0          74m
inspection-extension-789bb48b6-mnlqj     1/1     Running     0          73m
intent-agent-cfb49d788-cq8tk             1/1     Running     0          73m
policy-sync-extension-686c757989-jftjc   1/1     Running     0          73m
policy-webhook-5cdc7b87dd-8shlp          1/1     Running     0          73m
policy-webhook-5cdc7b87dd-fzz6s          1/1     Running     0          73m
sync-agent-84bd6c7bf7-rtzcn              1/1     Running     0          73m
5. Now at this point click on "Verify Connection" button to confirm the agent in your k8s cluster is able to communicate with TMC
6. Now let's search for out cluster on the "Clusters" page as shown below
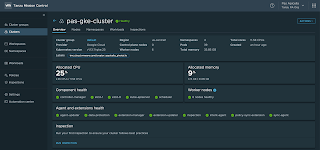
7. Click on "pas-gke-cluster" and you will be taken to an Overview page as shown below. Ensure all green tick boxes are in place this may take a few minutes so refresh the page as needed
8. So this being an empty cluster I will create a deployment with 2 pods so we can see how TMC shows this workload in the UI. These "kubectl commands" should work on any cluster as the image is on Docker Hub
$ kubectl run pbs-deploy --image=pasapples/pbs-demo-image --replicas=2 --port=8080
$ kubectl expose deployment pbs-deploy --type=LoadBalancer --port=80 --target-port=8080 --name=pbs-demo-service
9. Test the workload (Although this isn't really required)
$ echo "http://`kubectl get svc pbs-demo-service -o jsonpath='{.status.loadBalancer.ingress[0].ip}'`/customers/1"
http://104.197.202.165/customers/1
$ http http://104.197.202.165/customers/1
HTTP/1.1 200
Content-Type: application/hal+json;charset=UTF-8
Date: Tue, 11 Feb 2020 01:43:26 GMT
Transfer-Encoding: chunked
{
"_links": {
"customer": {
"href": "http://104.197.202.165/customers/1"
},
"self": {
"href": "http://104.197.202.165/customers/1"
}
},
"name": "pas",
"status": "active"
}
10. Back on the TMC UI click on workloads. You should see our deployment as per below
11. Click on the deployment "pbs-deploy" to see the status of the pods created as part of the deployment replica set plus the YAML of the deployment itself
12. Of course this is just scratching the surface but from the other tabs you can see the cluster nodes, namespaces and other information as required not just for your workloads but also for the cluster itself
One thing to note here is when I attach a cluster as shown in this demo the life cycle of the cluster, for example upgrades, can't be managed / performed by TMC. In the next post I will show how "Create Cluster" will actually be able to control the life cycle of the cluster as well as this time TMC will actually create the cluster for us.
Stay tuned!!!
More Information
Introducing VMware Tanzu Mission Control to Bring Order to Cluster Chaos
https://blogs.vmware.com/cloudnative/2019/08/26/vmware-tanzu-mission-control/
VMware Tanzu Mission Control
https://cloud.vmware.com/tanzu-mission-control


No comments:
Post a Comment